Reference
Reading a synoptic chart the night before
A surface pressure chart is a forecast of light as much as of weather. What the isobars and the front symbols are telling you, and which part of the pattern is worth an alarm clock.
Published 24 April 2026 Reference Reference note
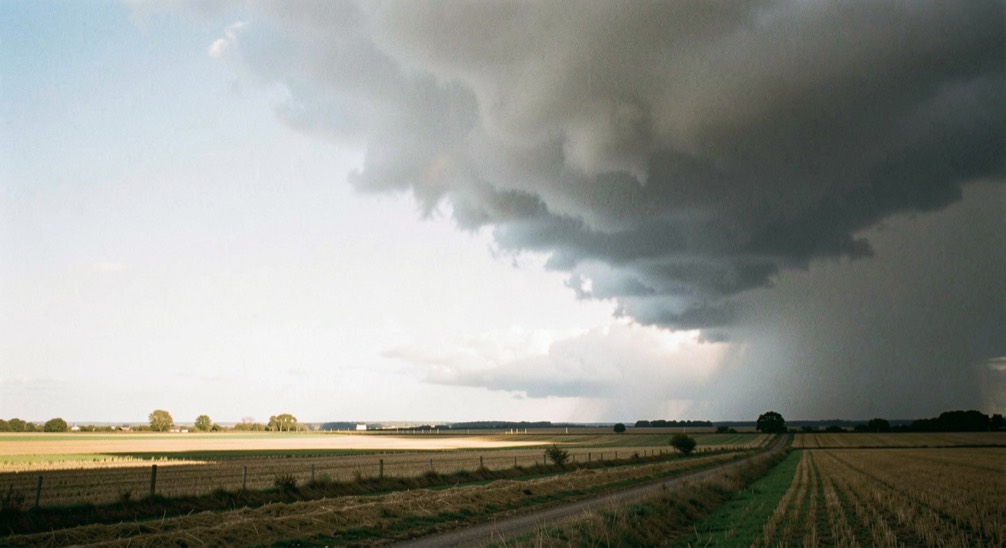
A surface pressure chart is the most useful single document in landscape photography and it takes about twenty minutes to learn to read at the level required. It shows pressure, wind and fronts, and from those three things almost everything that matters follows: whether the air will be clear, where the cloud will break, whether there will be frost, and which hour of which day is worth getting up for. The national charts are published several days ahead by the national weather service and are free to look at.
Isobars
The lines are contours of equal atmospheric pressure at sea level, drawn on British charts at intervals of four hectopascals, which are the same unit as the older millibars. Two facts come straight off them.
The first is wind strength. The wind blows because of the pressure difference between one place and another, so the closer the isobars are packed, the stronger the wind. A chart with lines you could park a car between is a calm day; a chart where they are two millimetres apart is a day when a filter holder becomes a liability, which is the subject of the entry on filter kits that survive hill wind.
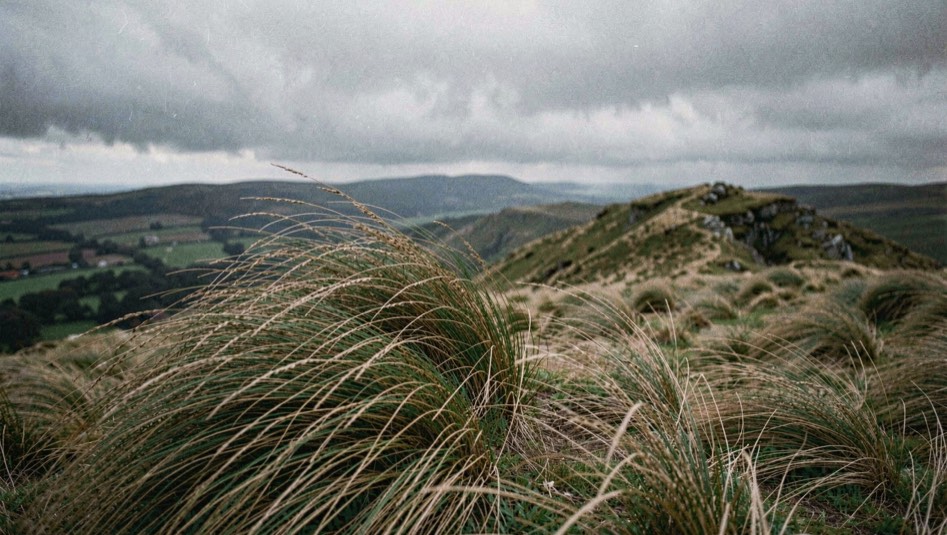
The second is wind direction. The wind does not blow from high to low across the lines; friction turns it slightly, but it runs broadly along them, anticlockwise around a low and clockwise around a high in this hemisphere. The old sailor's rule still works: stand with your back to the wind and the low pressure is on your left. For a photographer this is how you know whether a sea fog will be pushed ashore or held offshore, and whether a swell will be pointed at the coast you were planning to visit.
The front symbols, and which side to be on
Warm front
Drawn as a line with semicircles on the leading edge. Warm air is riding up over colder air ahead of it, so the cloud thickens and lowers hours before anything falls, and the rain when it comes is steady and prolonged. Behind the warm front lies the warm sector, which for photography is usually the worst air in the whole system: low grey cloud, poor visibility, drizzle, and no structure anywhere.
Cold front
Drawn with triangles on the leading edge. Colder air is undercutting the warm air and forcing it up sharply, so the rain arrives in a narrow, intense band with a hard back edge. That back edge is the single most photographically productive line on any chart. Behind it the air is cold, clean and unstable: visibility goes up dramatically, showers form with clear gaps between them, and low sun comes through under a broken sky.
Occluded front
Drawn with alternating triangles and semicircles, usually in purple. It forms when a cold front catches up with the warm front ahead of it and lifts the warm air clear of the surface. Occlusions are the untidy end of a depression: general cloud, patchy rain, and a slow, unsatisfying clearance.
Trough
A bold line without symbols, marking a line of instability without a proper air mass change. Troughs produce showers, sometimes heavy, and gaps between them, which on the right ground is very usable light.
On the ground
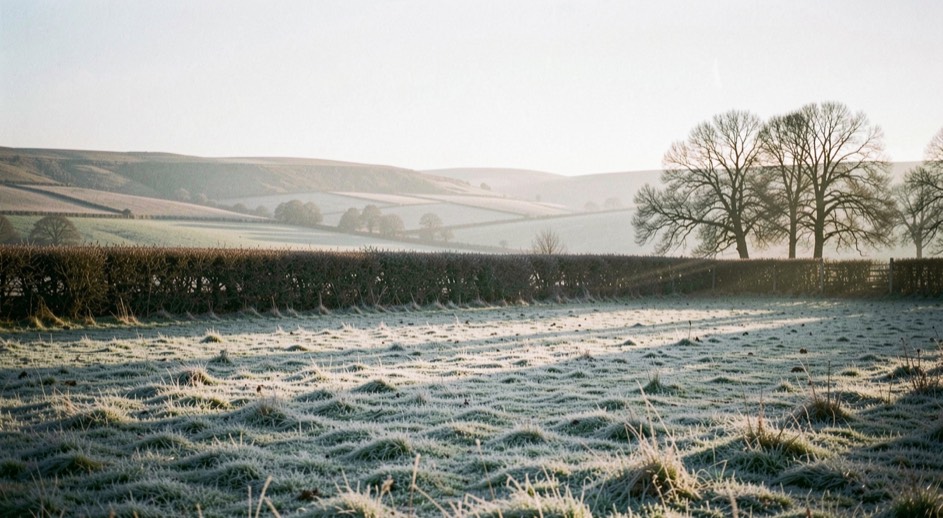
The single most useful pattern to look for is a cold front crossing the country overnight with a ridge of high pressure following it. That gives clearing skies before dawn, cold clean air, a good chance of frost or mist in the valleys, and light wind. It is worth rearranging a week for.
The pattern to be suspicious of is a slow moving warm front approaching from the west during the afternoon. The forecast may still say dry, and the light will die three hours before the rain arrives.
Highs, lows, ridges and cols
A low is a depression: rising air, cloud, rain, wind, and a sequence of fronts turning around it. Lows are not automatically bad news, because the gaps between their fronts contain some of the best light of the year; they simply require timing.
A high is subsiding air, which suppresses cloud formation and gives settled weather. In summer that means clear, hot, hazy days with flat light in the middle of them; in winter it means either sharp frost and clarity, or a trapped grey layer that never lifts, which is anticyclonic gloom. Which of the two you get depends on how much moisture is trapped below the inversion, and there is no way to read that off the isobars alone; the humidity and the previous week's rainfall decide it.
A ridge is a finger of high pressure between two systems, and it is the window everyone wants: a day, sometimes only a morning, of clear air and light wind between one front and the next. A col is the slack area between two highs and two lows, with almost no pressure gradient at all, and it is where fog and frost form because nothing is moving.
Turning the chart into a departure time
The chart gives the pattern; a few other numbers turn it into a plan. Cloud base height decides whether a hill is in cloud or above it. The overnight minimum temperature compared with the dew point decides whether there will be valley fog, which is the mechanism explained in the entry on inversions. Wind speed at height, not at the surface, decides whether a ridge is workable. And on the coast, the tide decides whether the ground you intend to stand on will be there, which is a separate calculation set out in the note on tide tables.
Charts are usually issued in a sequence out to five days. The useful discipline is to look at the whole sequence rather than one frame of it, because what matters is the speed the pattern is moving: a front that crosses in six hours and one that takes two days look identical on a single chart and produce completely different days. Two consecutive charts twelve hours apart tell you which one you are dealing with.
The last step is honesty about confidence. Beyond about seventy two hours the position of a front is an estimate, and beyond five days the pattern is a suggestion. Plan the ground that far out, plan the hour the night before, and accept that a proportion of mornings will be wrong. The response to a wrong morning is in the entry on making use of flat light rather than in the car park.
A chart read the night before is only half the work. The other half is knowing what a place does with the weather it gets, and how the people there organise around it. The same habit of attention applies to any cluster of activity in one place: four stations in one city, and what a permanent notice on the door says about the trade behind it. That is the subject of a new field-craft page, four stations in one city, which looks at a local radio group in Lubbock and how it is run.